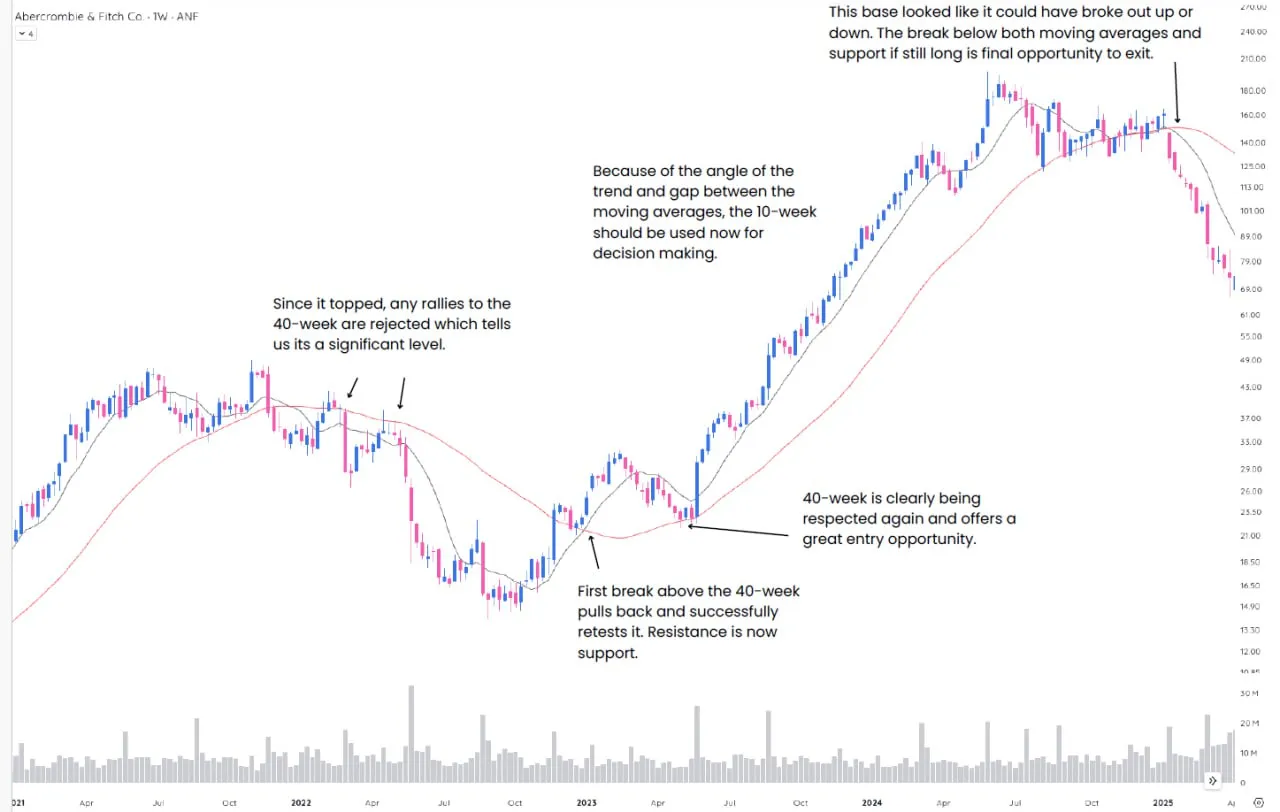
Contains more than 100 charts with explanation from 2019-2025
相关推荐


最新订单
-
ca***e购买了 ¥399.00J Law Master Your Trade MYT Membership 2026(含突发讯息)中文字幕和英文字幕
-
zh***i购买了 ¥399.00Sam Lam 投資筆記 Investment Radar PRO(含突发)
-
R***Y购买了 ¥19.902026 Market Wizards: The Next Generation: The world's top young traders reveal how they beat the market
-
H***购买了 ¥189.00J Law Master Your Trade MYT Membership 2026(含突发讯息)中文字幕和英文字幕
-
W***l购买了 ¥350.00Momentum Investor 動能投資者 MIM - VIP會員


