Overview
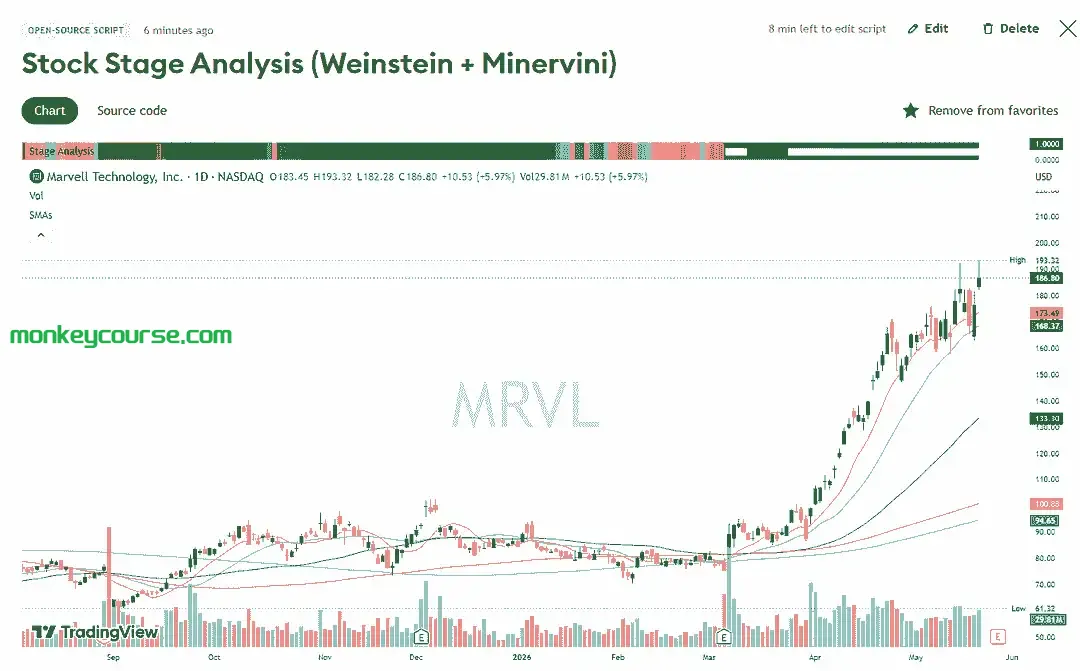
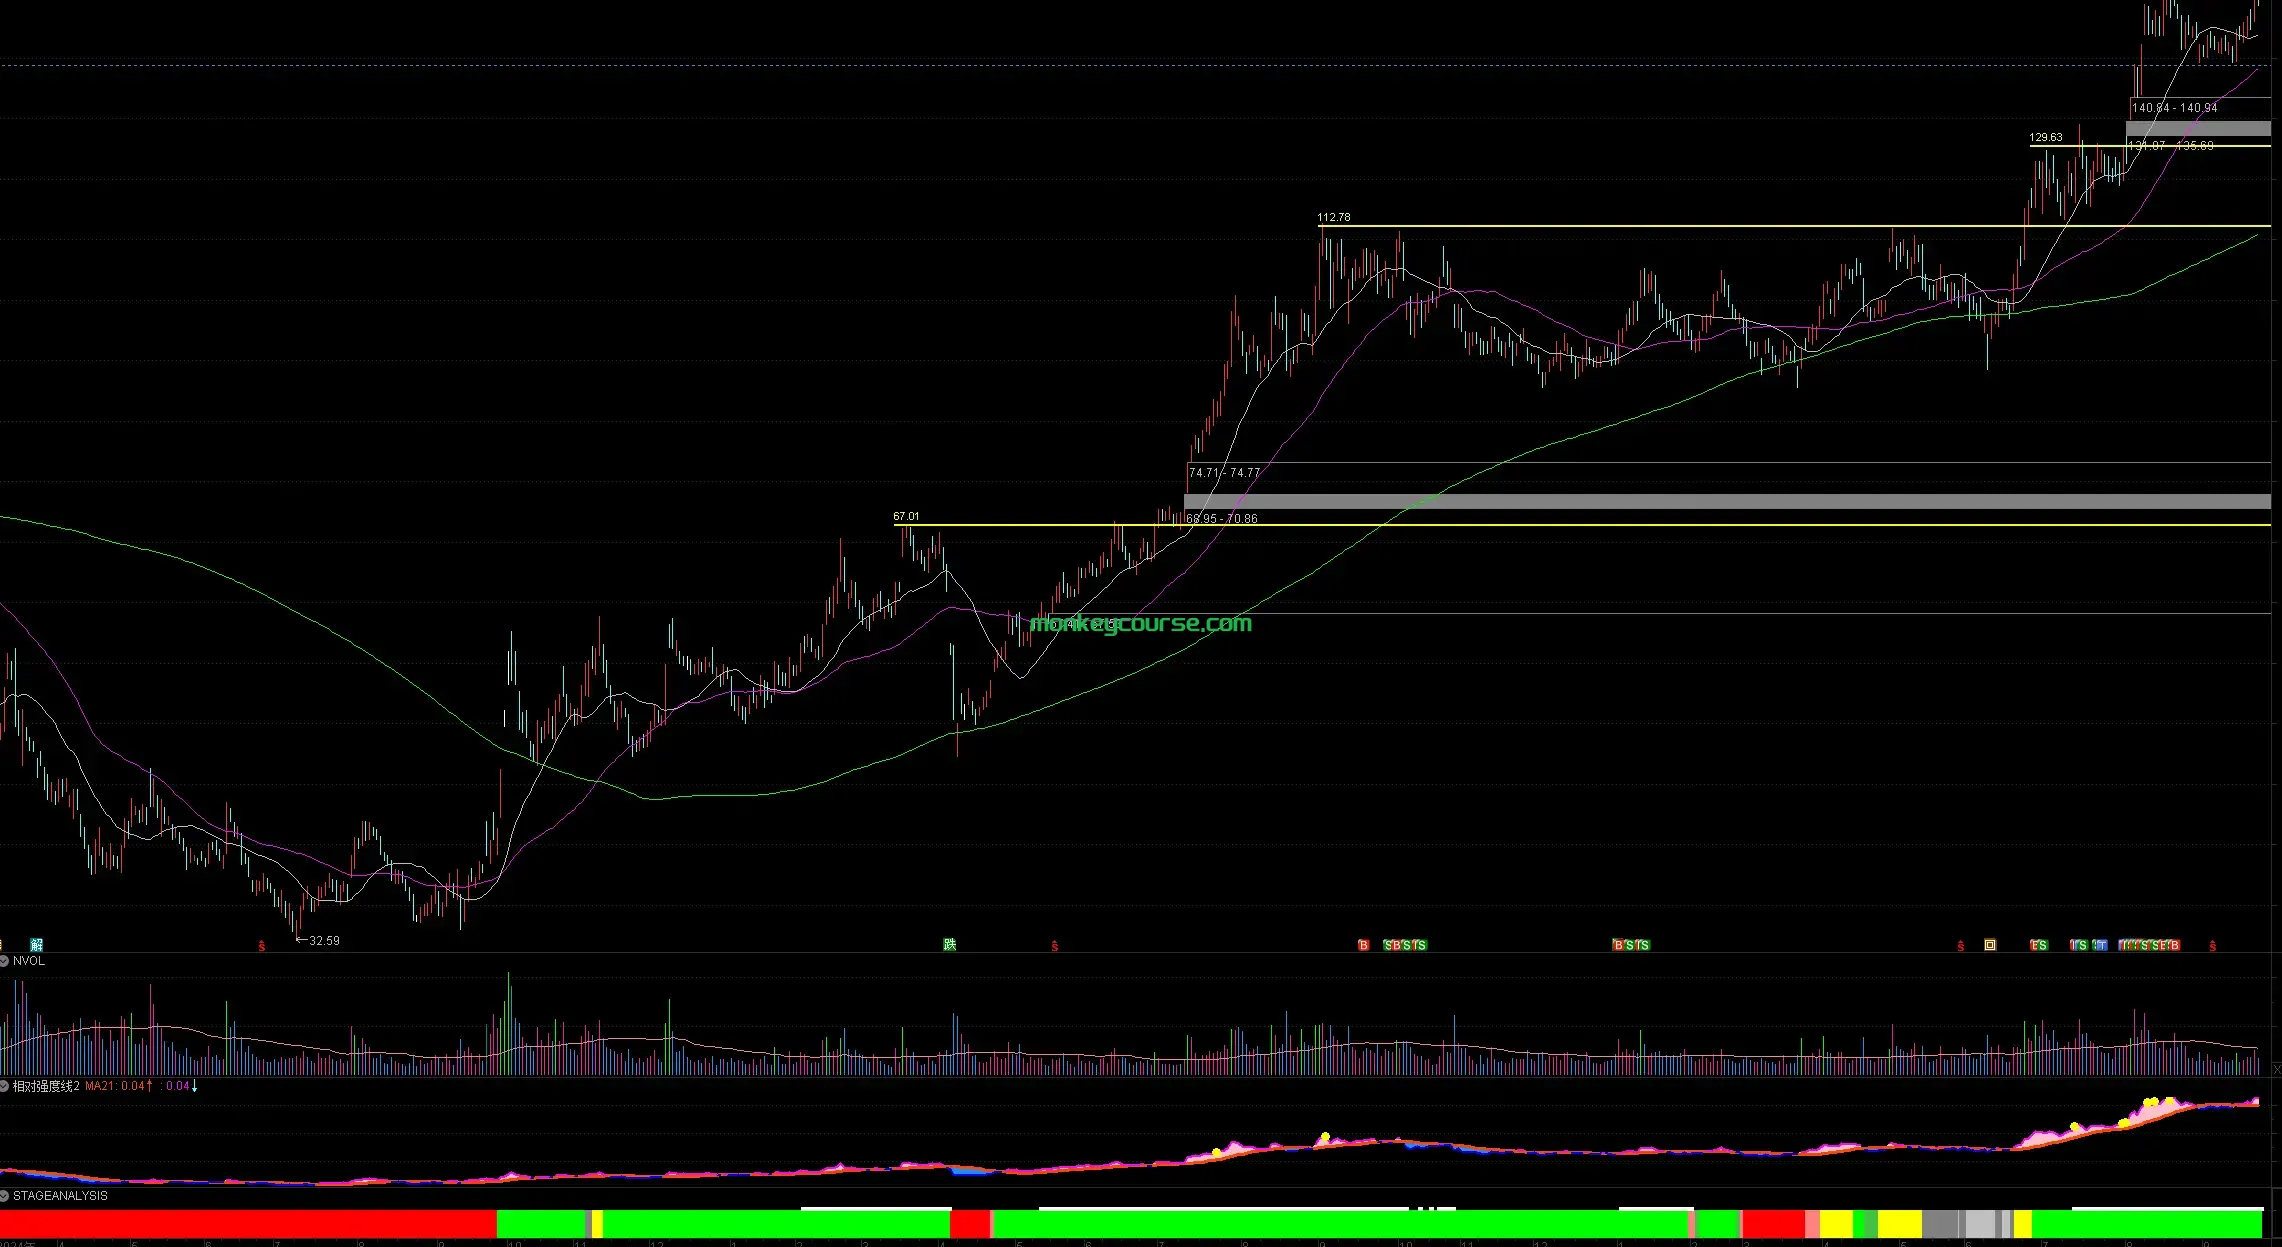
This indicator combines Stan Weinstein's Stage Analysis with Mark Minervini's Trend Template to identify the best buying opportunities in stocks. It displays a color-coded bar at the bottom of your chart showing which stage the stock is currently in.
Color Coding
The indicator displays a horizontal colored bar with gradient intensity based on trend strength:
Stage 1 - GRAY (Basing/Accumulation)
- Stock is consolidating after a decline
- 150-day MA is flattening out
- Price oscillating around the 150-day MA
- Action: WATCH - Building a base, not yet ready to buy
Stage 2 - GREEN (Advancing/Markup) ⭐
- Stock is in a confirmed uptrend
- Price above 150-day MA
- 150-day MA sloping upward
- 50-day MA above 150-day MA
- Action: BUY ZONE - This is where you want to buy
- Gradient: Light green = weak trend, Dark green = strong trend
Stage 3 - YELLOW/ORANGE (Topping/Distribution)
- Stock momentum is weakening
- 150-day MA flattening after an uptrend
- Price oscillating around 150-day MA
- Action: SELL - Institutional distribution happening
Stage 4 - RED (Declining/Markdown)
- Stock is in a confirmed downtrend
- Price below 150-day MA
- 150-day MA sloping downward
- Action: AVOID - Do not buy or hold
- Gradient: Light red = weak downtrend, Dark red = strong downtrend
⬜ White Square Marker (Minervini Qualified)
When you see a small white square at the top of the Stage 2 bar, this indicates a high-quality buying opportunity that meets ALL of Mark Minervini's strict criteria:
✅ Stock is in Stage 2 (uptrend)
✅ Price > 50-day MA > 150-day MA > 200-day MA (perfect alignment)
✅ 200-day MA is trending upward
✅ Price within 25% of 52-week high
This is the ideal entry point - Stage 2 stocks that also pass Minervini's quality filter.
📈 How to Use in Your Trading
Step 1: Find Stage 2 Stocks
- Look for GREEN bars on the indicator
- These are stocks in confirmed uptrends
Step 2: Look for White Squares
- The white square marker identifies the highest quality Stage 2 setups
- These stocks meet both Weinstein and Minervini criteria
Step 3: Check the Gradient Intensity
Dark green = Strong momentum (safer entry)
Light green = Weaker momentum (wait for confirmation)
Step 4: Exit Signals
- When the bar turns YELLOW = Start reducing position
- When the bar turns RED = Exit completely
⚙️ Installation
- Open TradingView
- Click Pine Editor at the bottom
- Click "+" to create new indicator
- Paste the script code
- Click "Save" and "Add to Chart"
🧠 Methodology
Weinstein Stage Theory
- Uses the 30-week (150-day) moving average to identify the four stages of stock price cycles. Stage 2 is the only stage where you should be buying.
Minervini Trend Template
- Applies stricter criteria within Stage 2 to filter for the highest-quality setups with proper moving average alignment and relative strength.
- Gradient Intensity
- Color intensity is calculated based on:
- MA slope steepness (steeper = darker)
- Price distance from MA (further = darker)
This helps you visually assess trend strength at a glance.
🎯 Trading Rules
BUY: Stage 2 (green) with white square marker
HOLD: Stage 2 (green) without marker (monitor closely)
SELL: Stage 3 (yellow/orange)
AVOID: Stage 1 (gray) and Stage 4 (red)
📝 Technical Parameters
50-day MA: Short-term trend
150-day MA: Primary stage identifier (Weinstein's 30-week)
200-day MA: Long-term trend filter
52-week high: Relative strength filter
MA slope threshold: ±0.5% over 20 bars
Based on:
Stan Weinstein's "Secrets for Profiting in Bull and Bear Markets"
Mark Minervini's "Trade Like a Stock Market Wizard"
⚠️ Disclaimer
This indicator is for educational purposes only. It does not constitute financial advice. Always do your own research and use proper risk management. Past performance does not guarantee future results.
📌 Quick Reference Card
Remember: Only buy Stage 2 stocks. The white square identifies the cream of the crop.
最新拼团


相关推荐
-
Rick Saddler – Road Trip with Continuation Patterns CourseCNY¥399.00
-
King Of Forex – The 1 Trading StrategyCNY¥39.00
-
精英财经LABanker 王哥CNY¥19.00
-
Ultimate Brain + Creator's Companion 3.0 Bundle Ultimate Brain Creator 3.0-Notion TemplateCNY¥99.00
-
Jesse Livermore Best and Worst Trading Lessons 2023 by John PocorobbaCNY¥199.00


最新订单
-
J***y购买了 CNY¥129.00MarketSmith.hk 笑傲股市 A股 + 港股 + 美股 指标分析全市场会员 Monthly Yearly PC电脑版
-
Ha***d购买了 CNY¥89.00XTrader 猫姐美股交易
-
s***h购买了 CNY¥299.002025 Train The Trader Program TTT 2.0 Full Course by J law 中文字幕
-
Ke***n购买了 CNY¥859.00J Law‘s TraderCircle 即時訊息 Trader Circle Real time notifications Services
-
Lo***d购买了 CNY¥799.00J Law‘s TraderCircle 即時訊息 Trader Circle Real time notifications Services