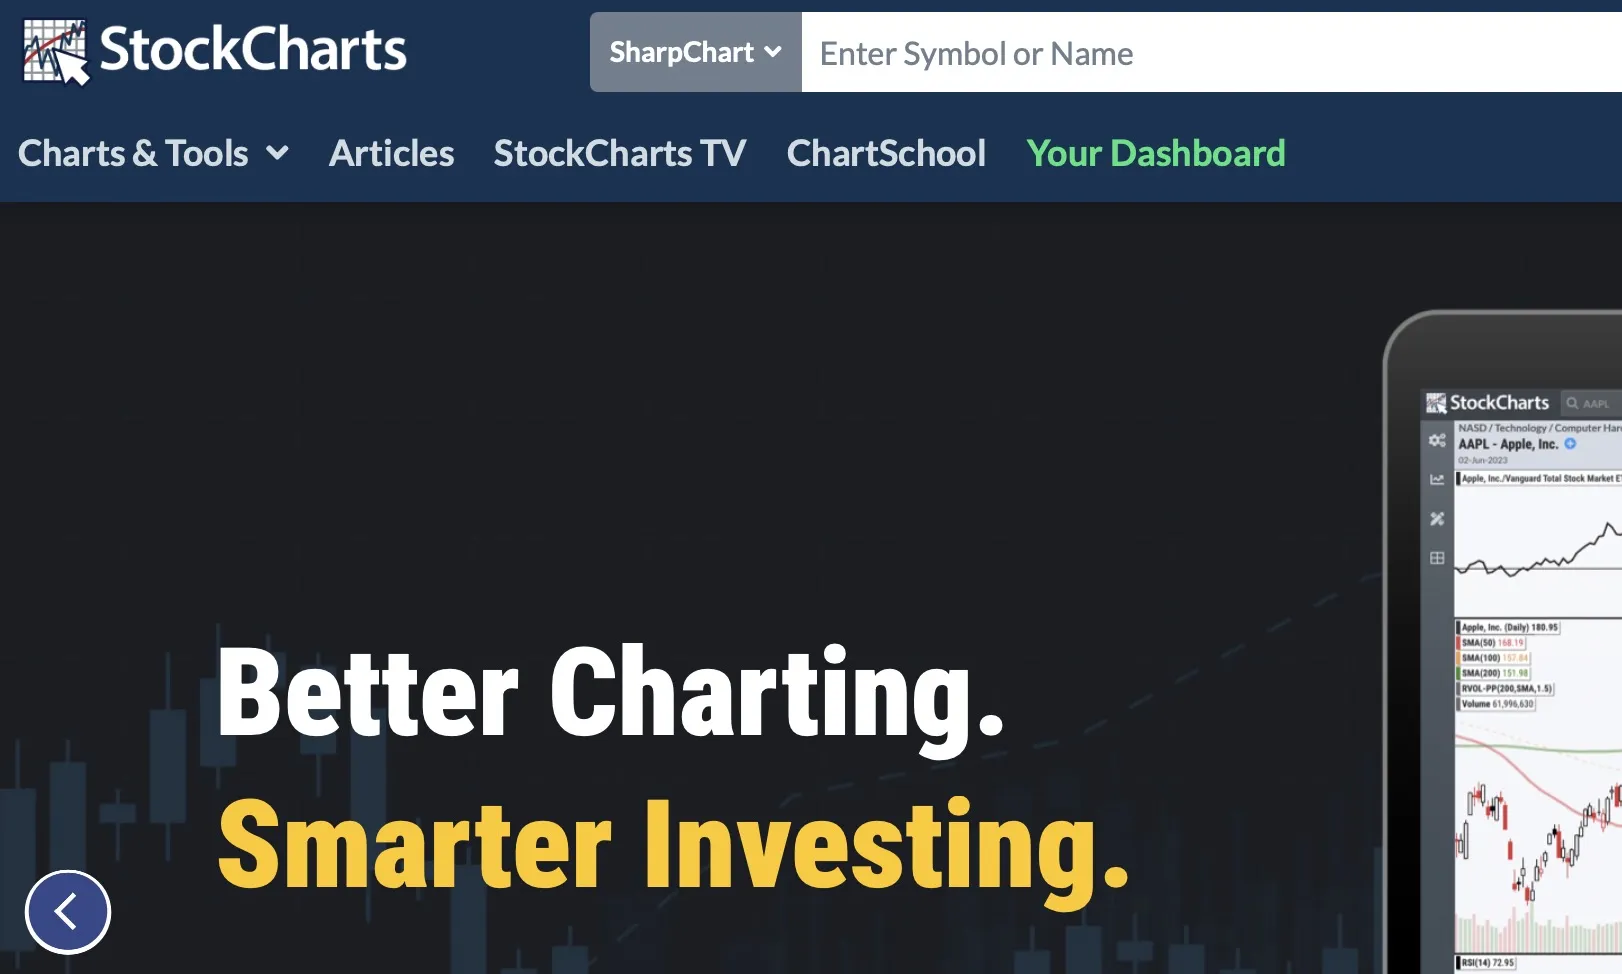
more info:https://stockcharts.com/
StockCharts is a financial charting and technical analysis platform for individual investors. It provides a variety of charting tools and resources for analyzing stocks, including real-time and historical price data, technical indicators, and chart patterns. It also offers a range of educational resources and tools for learning about technical analysis and investing in the stock market. StockCharts is a subscription-based service, and users can choose from a variety of subscription plans to access different levels of data and features.
Stockcharts Featurese ; –
- Charting tools: StockCharts provides a variety of charting tools and resources for analyzing stocks, including real-time and historical price data, technical indicators, and chart patterns. Users can create custom charts and save them for later analysis.
- Technical analysis indicators: StockCharts offers a range of technical indicators for analyzing stocks, such as moving averages, oscillators, and trendlines. Users can customize the indicators displayed on their charts and create alerts based on certain technical conditions.
- Market analysis tools: StockCharts provides resources for analyzing the overall stock market, including market summaries, sector performance, and trend analysis.
- Education resources: StockCharts offers a range of educational resources and tools for learning about technical analysis and investing in the stock market, including webinars, articles, and educational videos.
- Real-time data: StockCharts provides real-time data on stocks, indices, and other financial instruments, allowing users to track the latest market movements.
- Mobile app: StockCharts has a mobile app that allows users to access their charts and analysis tools on the go.
Customizable watchlists: Users can create custom watchlists to track specific stocks or groups of stocks. StockCharts provides alerts when certain technical conditions are met or when there are significant price movements.
What are the differences between extra, basic, and pro plans ?
- Basic: The basic subscription plan provides access to real-time stock charts and a limited number of technical indicators. It also includes educational resources and tools for learning about technical analysis and investing.
- Extra: The extra subscription plan includes all the features of the basic plan, as well as additional technical indicators and market analysis tools. It also includes access to real-time intraday data and historical data going back further in time.
- Pro: The pro subscription plan includes all the features of the extra plan, as well as additional technical indicators and market analysis tools, and access to real-time intraday data and historical data going back even further in time. It also includes access to exclusive content and tools, such as custom scans and expert market analysis.
- If you have any further questions, please contact us.